Machine monitoring to increase equipment availability

Machine downtimes or even standstills are the worst-case scenario in manufacturing. It is therefore obvious that maintenance is one of the elementary adjusting screws for making production more efficient and reducing costs.

Equipment and machine monitoring brings you the following benefits:

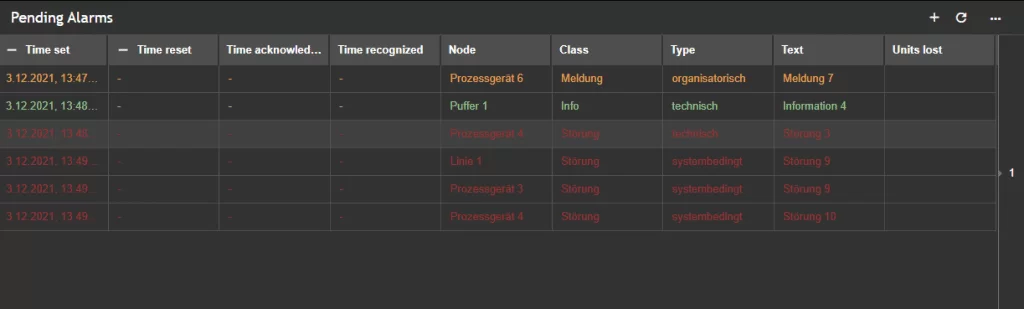
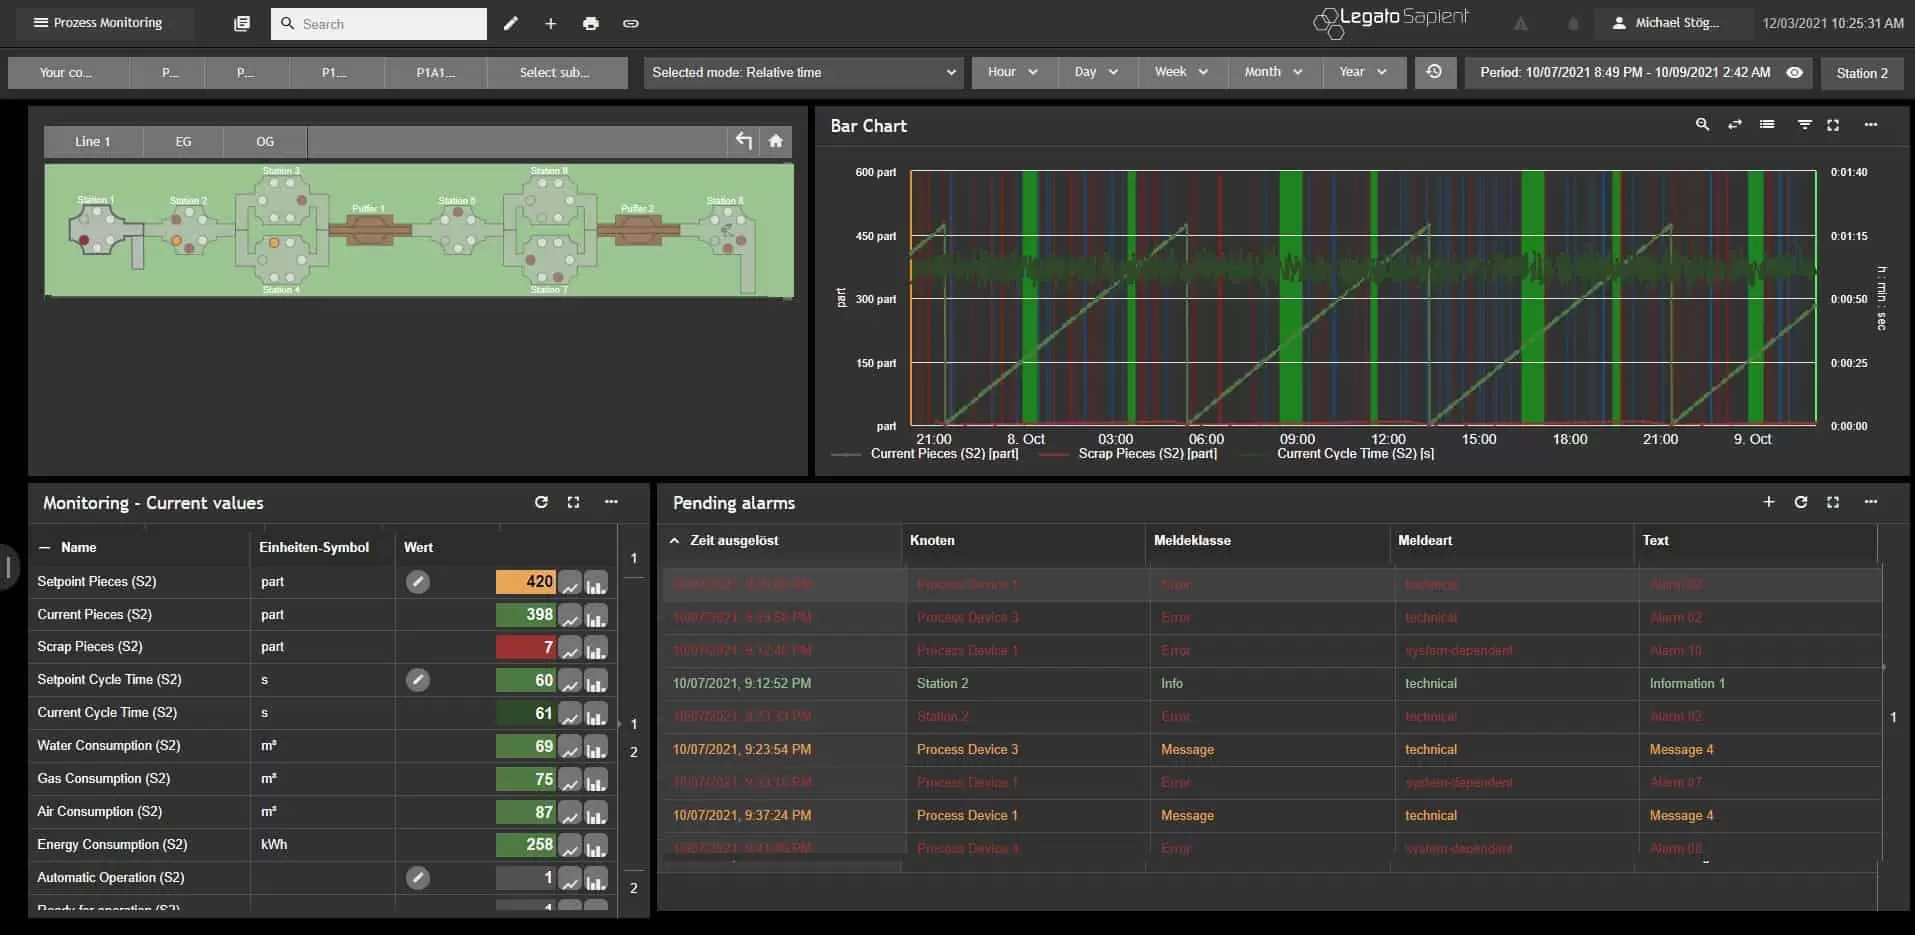
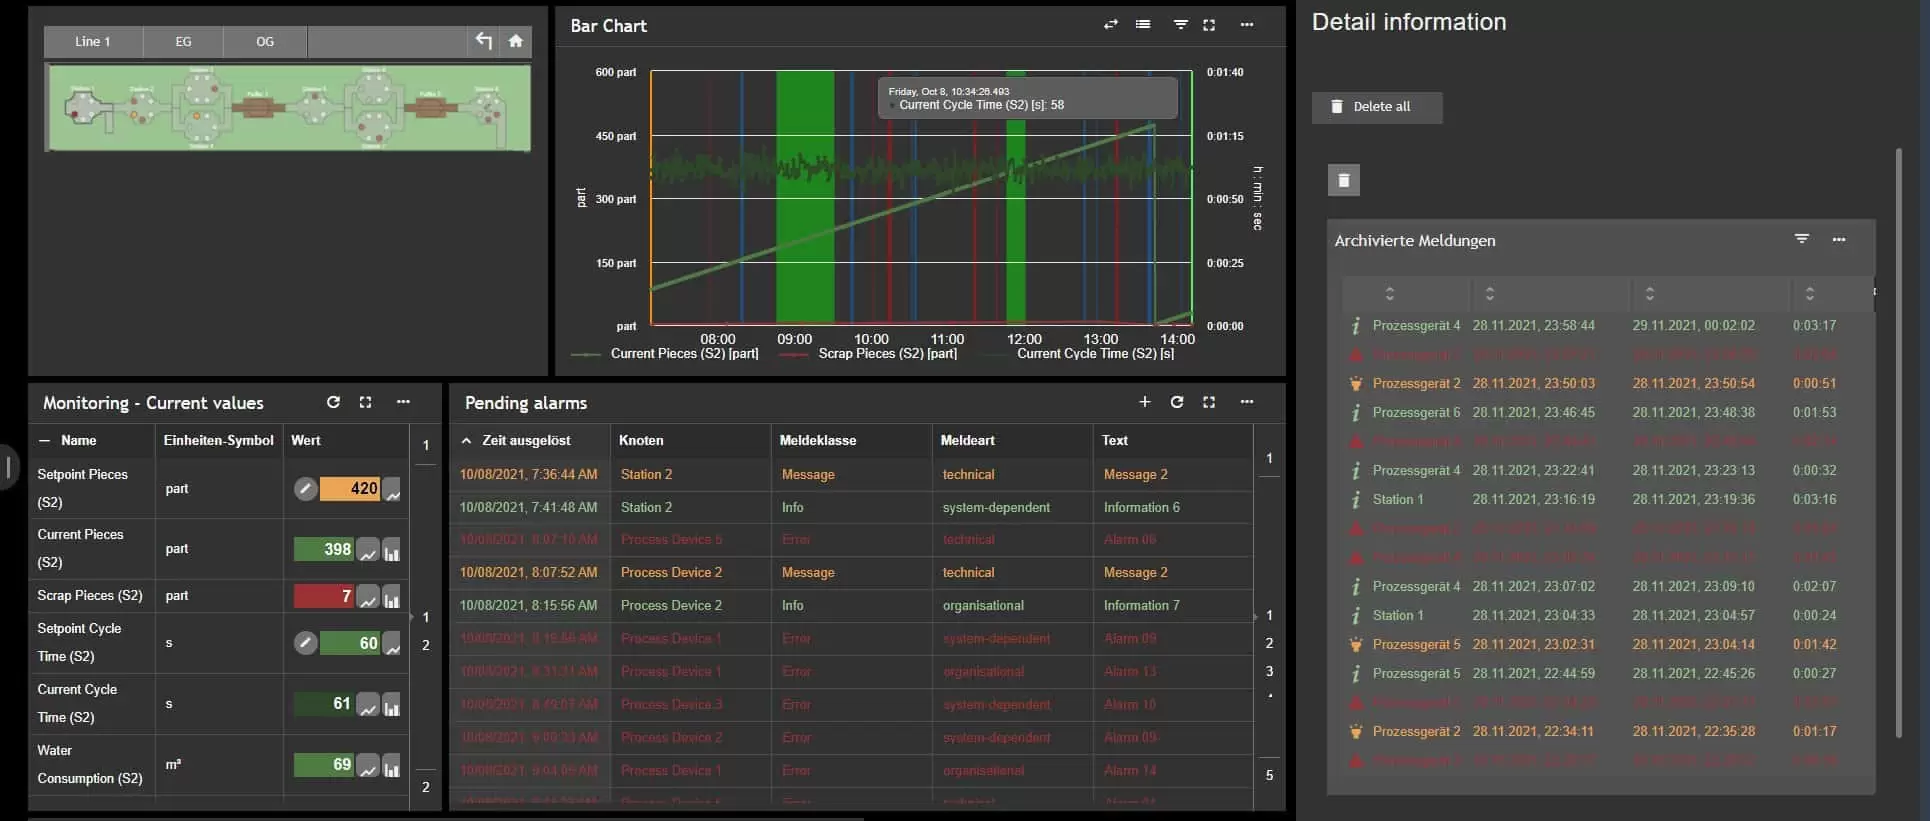
  • Greater transparency by machine monitoring throughout the entire manufacturing process
  • Faster detection of plant downtimes
  • Automatic notification system in case of downtime
  • Reduction of machine and plant downtimes
  • Increased output due to increased equipment availability

We would be pleased to show you the advantages of our MES software solution Legato Sapient in a personal appointment and to answer your questions in detail.

How to improve equipment availability

Unplanned plant downtimes are still one of the main cost drivers, as they are often detected too late. In addition, there is always a lack of error descriptions that show the problem in detail. As a result, additional time and capacity must be spent on looking for the cause of the problem – because until this is known, neither the right measures can be determined, nor the right maintenance contact alerted.

By identifying and eliminating unplanned plant downtimes more quickly, you can increase daily production by an average of ten percent.

However, central equipment and machine monitoring does not only offer added value in the event of a shutdown. Even without downtimes, process deviations can be detected more quickly, for example in the case of gradual deterioration due to longer cycle times or slowly increasing energy consumption. The possibility of target-performance comparisons of relevant process values, such as piece counts, cycle times or energy values, in real time provide direct information about unwanted deviations.

Competitive advantage due to central machine monitoring

Plant downtimes inevitably lead to production backlogs and a reduction in the number of pieces at the end of the day. These can often only be counteracted with overtime or the provision of reserve capacity. These costs often add up to a staggering amount.

Therefore, keep the number of plant downtimes as low as possible by increasing plant and equipment availability.

Companies that implement the following four parameters will always be prepared and create a true competitive advantage:

1. Machine data collection in real time

The availability of data creates transparency and is therefore a real added value for many processes. To be able to respond to ad hoc scenarios, the key to success lies in real-time data collection. This means that not only can a failure be communicated directly, but the cause can also be displayed. This significantly increases the ability to act and the speed of reaction and implementation.

Schematic of data collection in real time

2. Fast communication flow

In the event of an unplanned downtime, various groups of people and sub-processes are affected. Continuous and fast communication to all parties involved is essential to limit the damage and maintain the highest possible production efficiency despite the outage. For example, communication can take place via notifications on the smartwatches of the relevant maintenance personnel. This effectively creates a near real-time flow of information, regardless of where the employee is at the time of the incident.

Reporting of a machine malfunction on a smartwatch

3. Machine monitoring by intelligent analytics & comprehensible reporting

Learning from problems is the best approach to improvement. With the help of intelligent analysis methods and reporting, optimization potentials can be identified, and recurring problems eliminated in the long term. This enables you to act and react even better in the future – in line with the continuous improvement process (CIP).

Dashboard for machine monitoring

4. Real-time visualization in the plant-wide “control tower”

Central plant and machine monitoring enables you to a far-sighted view of the complete production process. With horizontal data integration, not only one specific machine or a limited area can be viewed. Through the real-time visualization and monitoring of the entire, partially interlinked process, an analysis of process correlations, as well as the effects of individual production problems can be seen.

Control Tower for central machine monitoring

Higher plant and equipment availability & ideal production efficiency

The module for centralized machine monitoring in our MES software solution Legato Sapient enables machine connectivity for real-time data collection – and this for both homogeneous and heterogeneous machine parks across different communication variants.

Regardless of which manufacturer the production machines are made by, over 2,000 machines can be connected in one single system.

Machine connectivity: simple & flexible

Based on this machine connectivity, indicators like process values and error messages can be recorded and visualized in real time. The user accesses the frontend via a standard web browser and is therefore independent of whether the information is required in the control station, via large displays, on mobile devices or on the PC.

The status of the plant, the production line or a machine can thus be queried in real time from anywhere and at any time.

Clear visualization of the production process

The graphical visualization makes it easier to identify problems, for example by schematic colorings of production areas or individual machines, depending on the status quo.

In the event of a downtime, maintenance is automatically notified via a call system or information on a smartwatch, and automatic escalation ensures that an employee takes care of the targeted maintenance.

Thanks to the recording of process values such as quantities, cycle times or even energy values in combination with continuous monitoring by means of defined target and limit values, the software solution enables optimized production efficiency beyond the case of a malfunction. Just as in the case of a shutdown, the system provides information about irregularities and deviations, thus offering not only monitoring but also the basis for optimized decision-making. This ensures that you get the best out of your production.

Target-performance-comparison for ideal plant and machine monitoring

Thanks to the recording of process values such as quantities, cycle times or even energy values in combination with continuous monitoring by means of defined set and limiting values, the software solution enables you to optimize production efficiency beyond the case of a malfunction. Just as in the case of a downtime, the system provides information about irregularities and deviations, thus offering not only monitoring but also the basis for optimized decision-making. This ensures that you get the best out of your production.

Zentrale Anlagenüberwachung für hohe Produktionseffizienz

Click Demo: Machine data collection reduces unplanned plant downtimes

The IT/OT Connector is the heart of the real-time data collection from the plant control system’s programmable logic controllers (PLCs). Both OEE data collection and production control are performed via this component. Once the data has been collected via the IT/OT Connector, it is processed further or displayed in the web visualization.

In the case of plant monitoring, there are two use cases:

  • Recognizing and eliminating gradual process deterioration (e.g., when cycle times slowly deteriorate)
  • Recognizing and remedying plant downtimes

Graphic visualizations help to detect plant downtimes, whether as a large display in production (ANDON), in the control station, or in a maintenance office.

real-time visualization with error messages
Here, all relevant details of a malfunction are displayed in a tabular view, whereby the level of detail can be set user-specifically.

Real-time visualization for “error-based drilldowns”

Depending on the application, different levels/depths of detail are used. Within a plant, operations typically take place on four levels:

Level 1: Layout for production and plant managers

The so-called plant overview shows the top level with colored representation of the individual areas. The color code represents the target-performance-comparison of quantities and thus provides an ideal overview of the performance within the production areas. Production or plant managers typically use this layout.

Level 2: Representation for production or maintenance managers

This is the display level for a production or maintenance manager of a unit or segment. In this case, the corresponding segment is shown subdivided by areas, with the rectangular boxes each representing the “issuing” plant of an area, and the round shapes each visualizing the various buffers, including fill level and limit values. This view already contains quite a lot of relevant “vital values” of the individual areas, such as “what kind of error is present” or piece count achievement (target-performance-comparison).

Level 3: Representation for line managers or supervisors

This display level is directed towards a line operator or supervisor. In this case, the corresponding production area is displayed subdivided by equipment, with the rectangular boxes representing the equipment and the round shapes again visualizing the buffers. The display of the information is continuous to the parent view.

Level 4: Representation for plant operators

The most detailed display is laid out for a machine operator. In this case, the corresponding machine is displayed with its robots. In addition to the robots, other relevant status information from safety gates or light barriers is visualized.

Evaluating process deviations with production visualization

Even if a plant downtime has not yet occurred, there is still a risk that the process is getting “out of control” slowly but surely. The MES software Legato Sapient helps to detect process deviations at an early stage.

With the help of the following dashboard, you can notice and correct process deviations in time. In the upper righthand section, deviations can be detected based on the piece count history (if the current actual piece count is running below the current target piece count).

visualization for process deviation detection

For more detailed analyses in relation to the piece counts, you can zoom into the diagram at the time of the deviation and open the sidebar with further analyses by one click. In the following, the associated malfunction for the selected period (zoom area in the diagram) are shown:

visualization for the detection of malfunctions

The user frontend contains numerous possibilities for interactions with the presented data. This guarantees maximum flexibility for detailed analyses and high plant and equipment availability as well as overall equipment effectiveness (OEE).

FAQ: Important questions about machine monitoring and plant availability

Here you will find answers to frequently asked questions about machine monitoring and equipment availability:

What does plant or equipment availability mean?

The terms plant, machine or equipment availability refer to a target-performance-comparison. They indicate the percentage of time a plant or machine has actually been producing compared to the planned production time. Machine availability is the analogous term for machinery.

What constitutes good plant or equipment availability?

Equipment availability is often expressed by the OEE indicator. If the available capacity is not being used ideally – as indicated by a value of less than 65% – the production process and efficiency should be optimized: Downtimes and error conditions of the production equipment should be analyzed urgently and thoroughly. If the value is above 65%, equipment availability is good. However, there is potential for optimization in the long term for every plant.

What does OEE stand for and how is this key figure determined?

OEE is the abbreviation for Overall Equipment Effectiveness. The OEE value is the product of the three factors

  • availability,
  • performance (utilization rate) and
  • quality.

Theoretically, it ranges between 0% and 100%.

Why is plant and machine monitoring important?

Only by monitoring your machinery will you get valuable insights and data. Companies can use OEE metrics to identify optimization potential and make decisions based on solid indicators.

The goal of central machine monitoring is to avoid unplanned downtime, scrap, and rework. This enables you to identify inefficient production areas and their causes and use this transparency to derive effective measures for systematically increasing productivity.