OEE monitoring – Increase your production output

Legato Sapient provides solutions for:

  • Comprehensive machine data acquisition for heterogeneous and homogeneous machine parks with more than 2000 machines
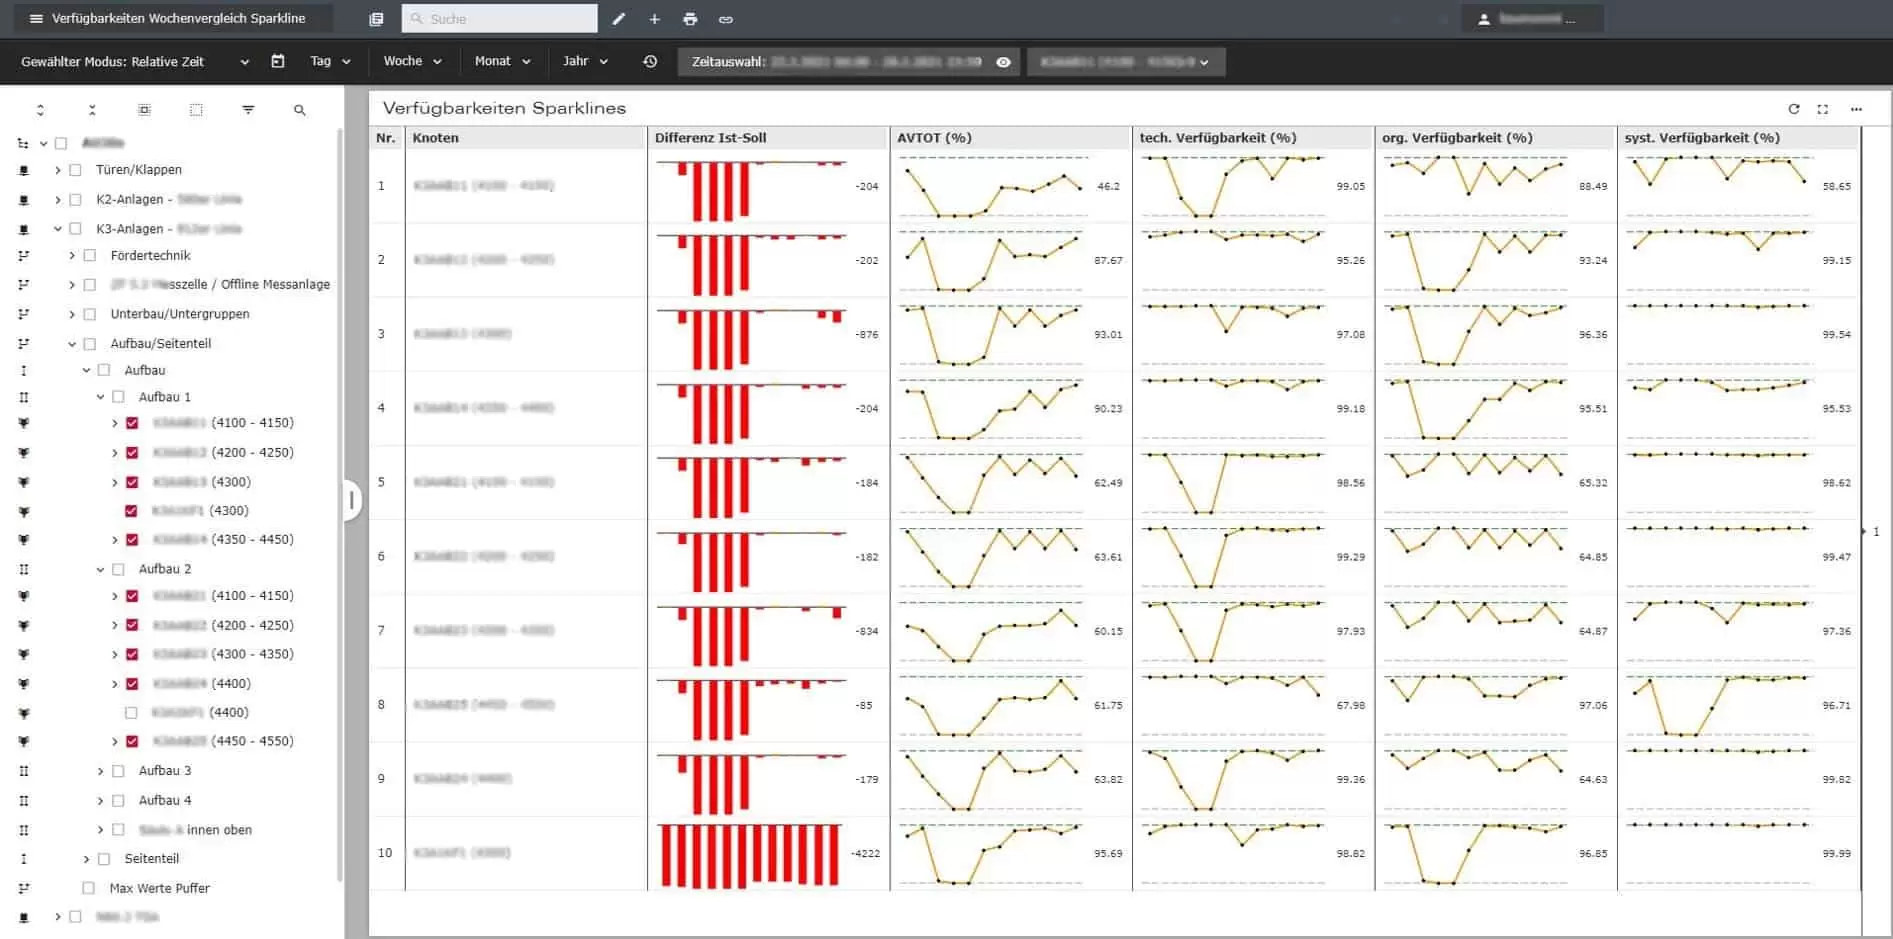
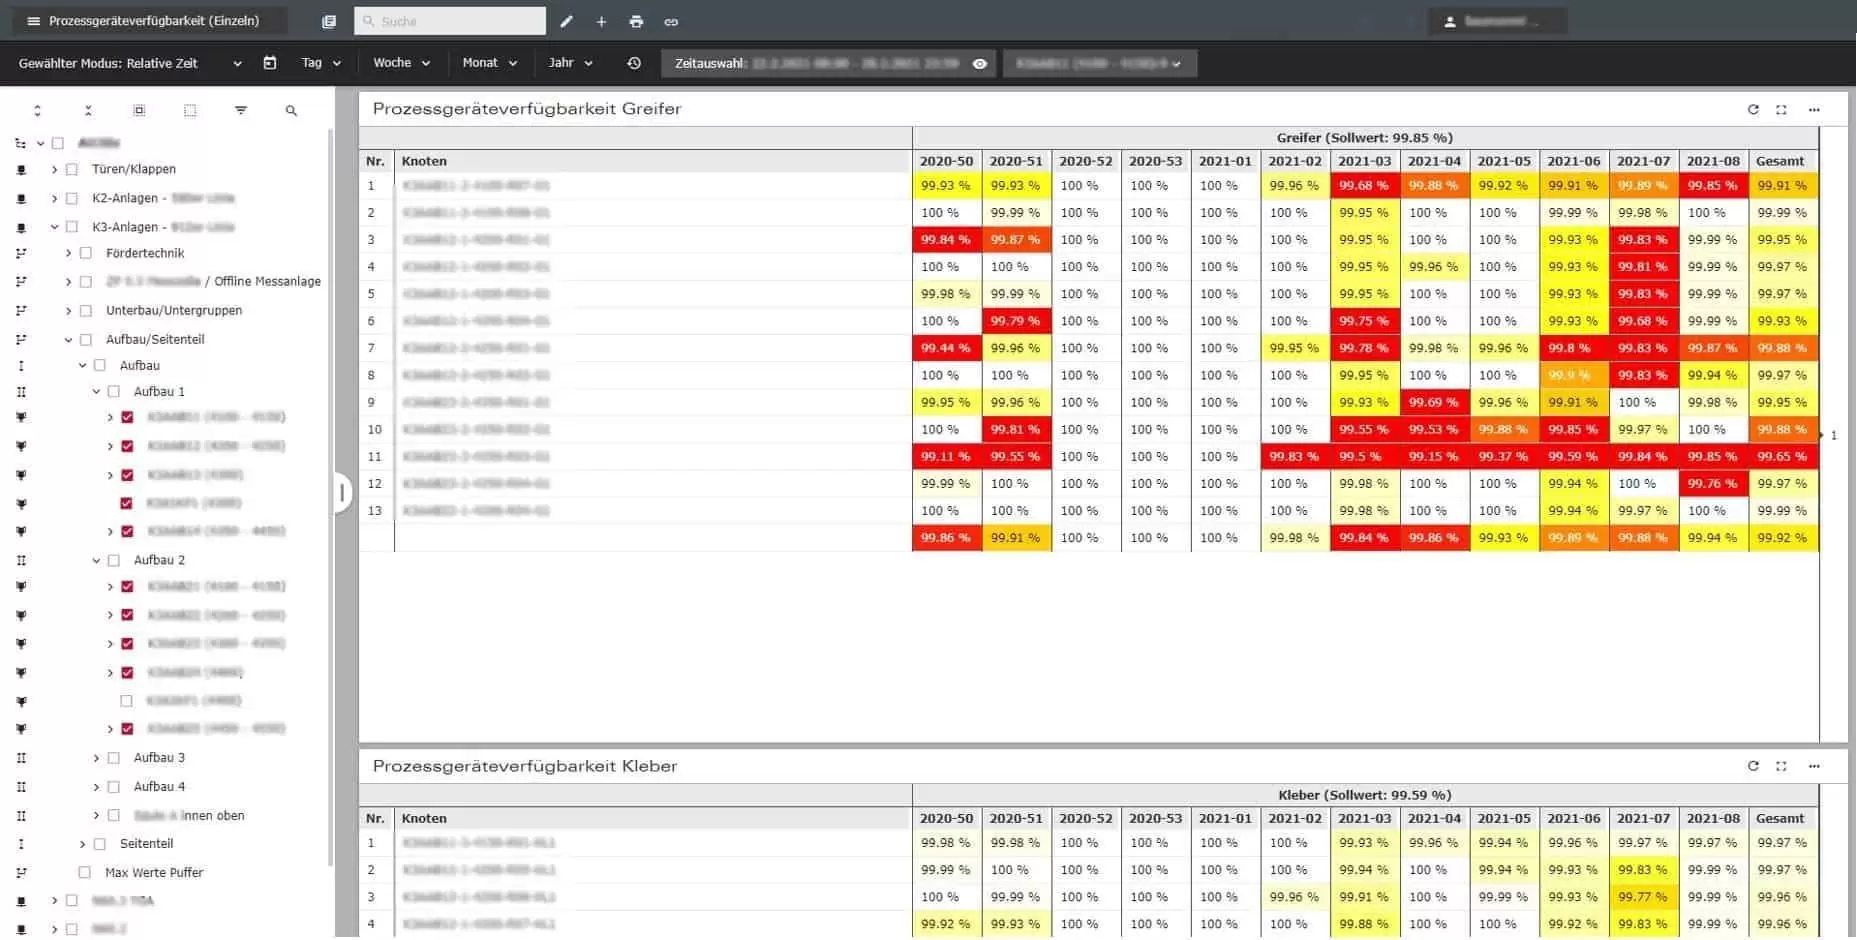
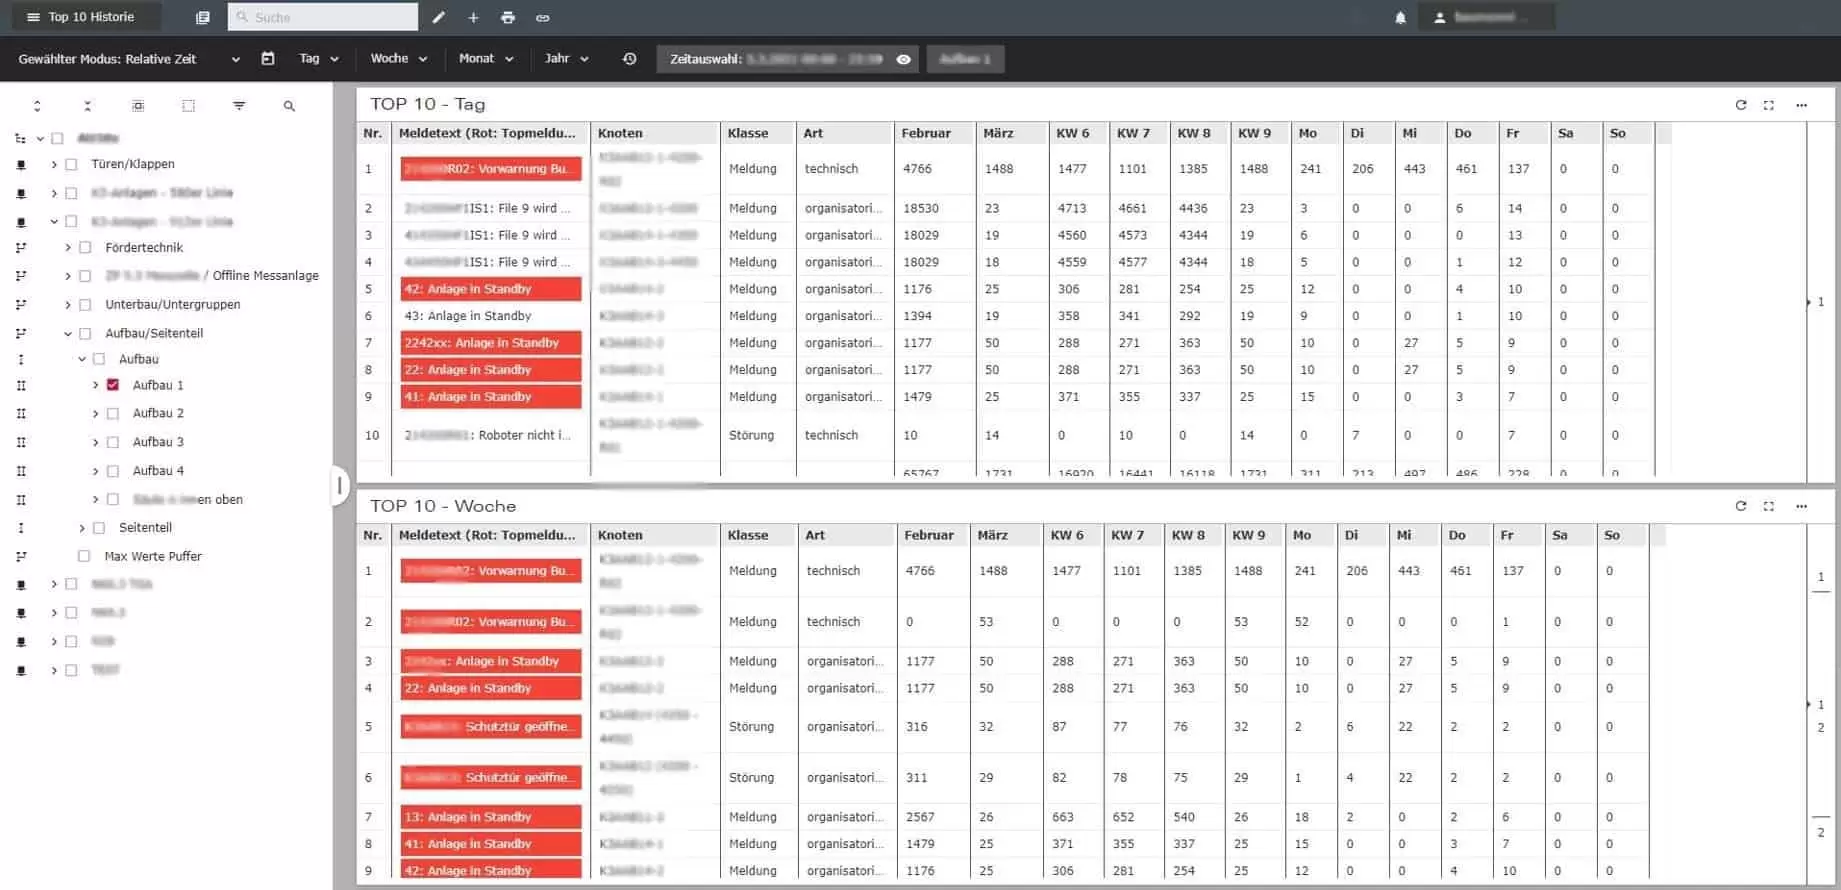
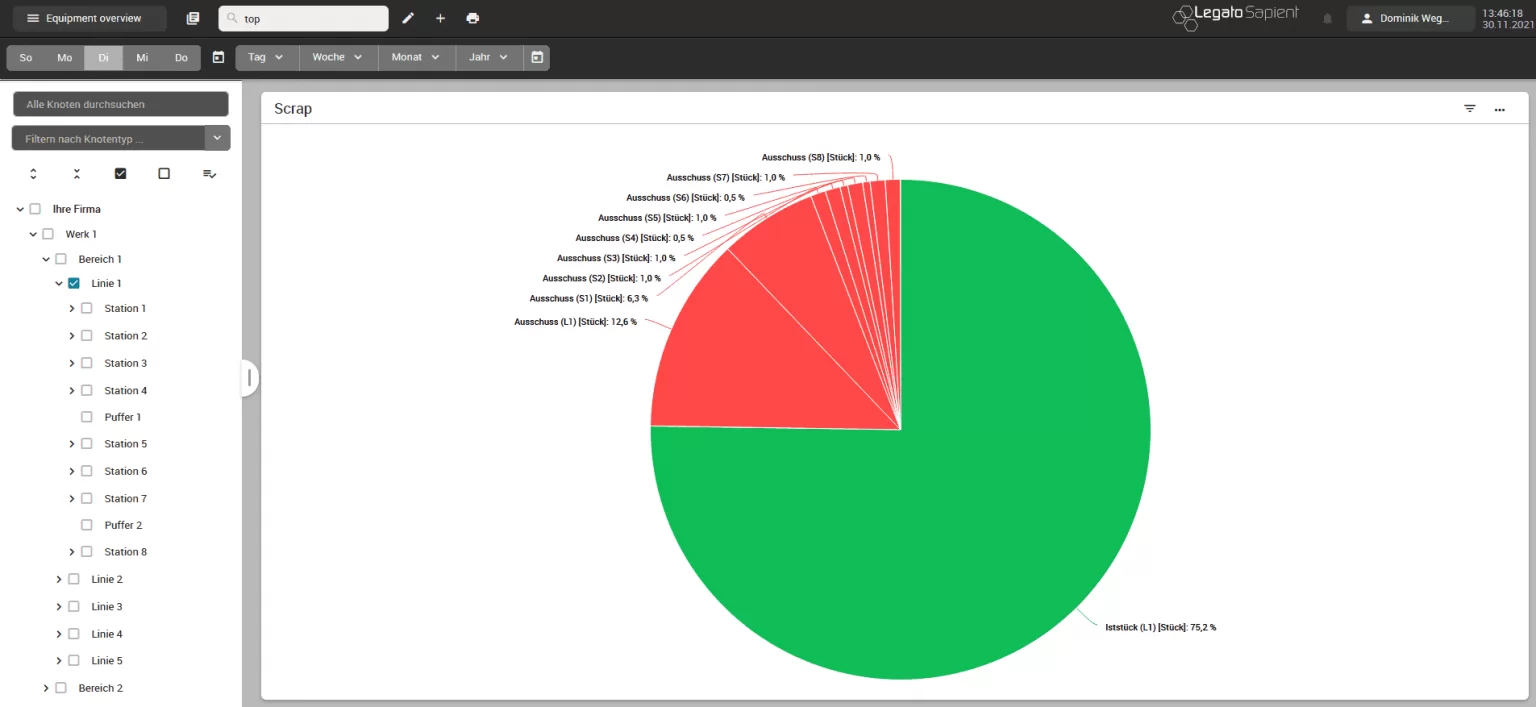
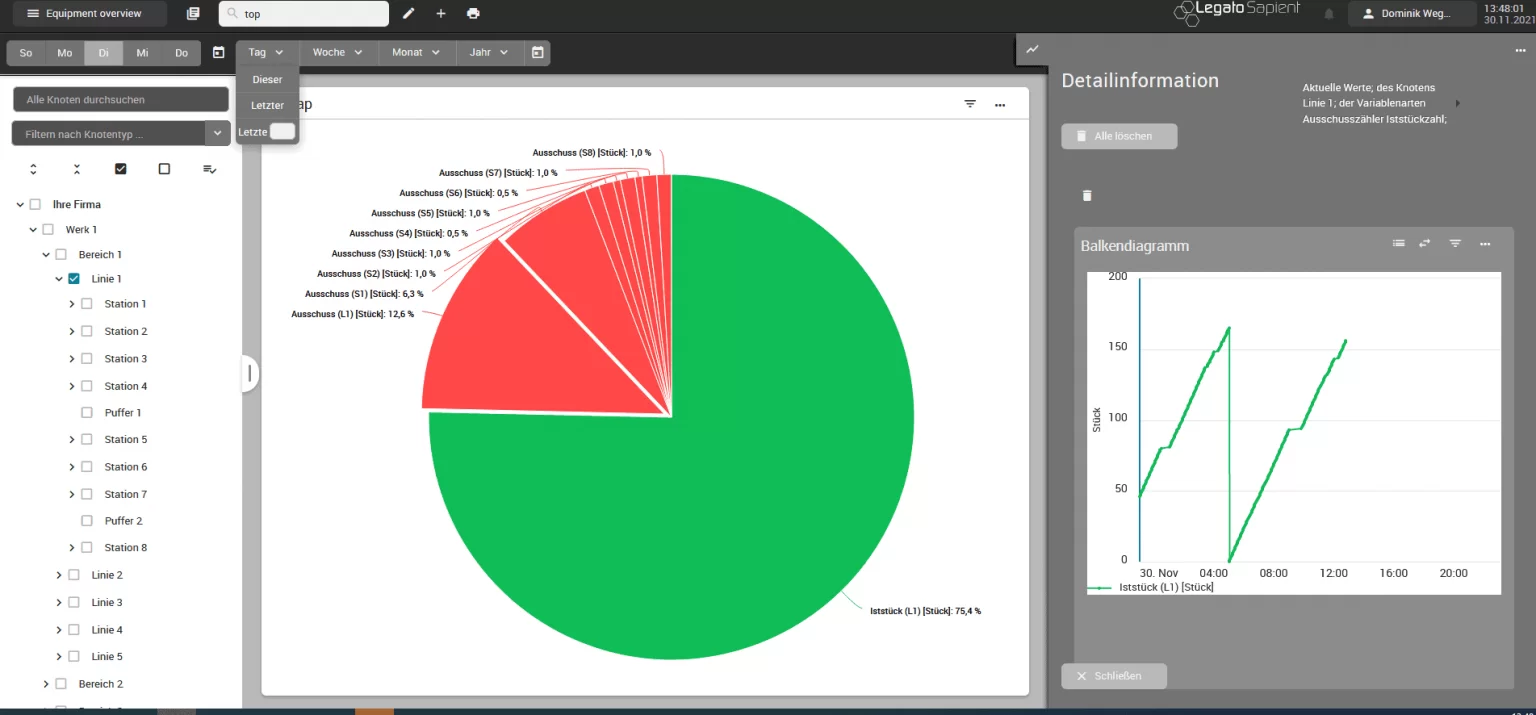
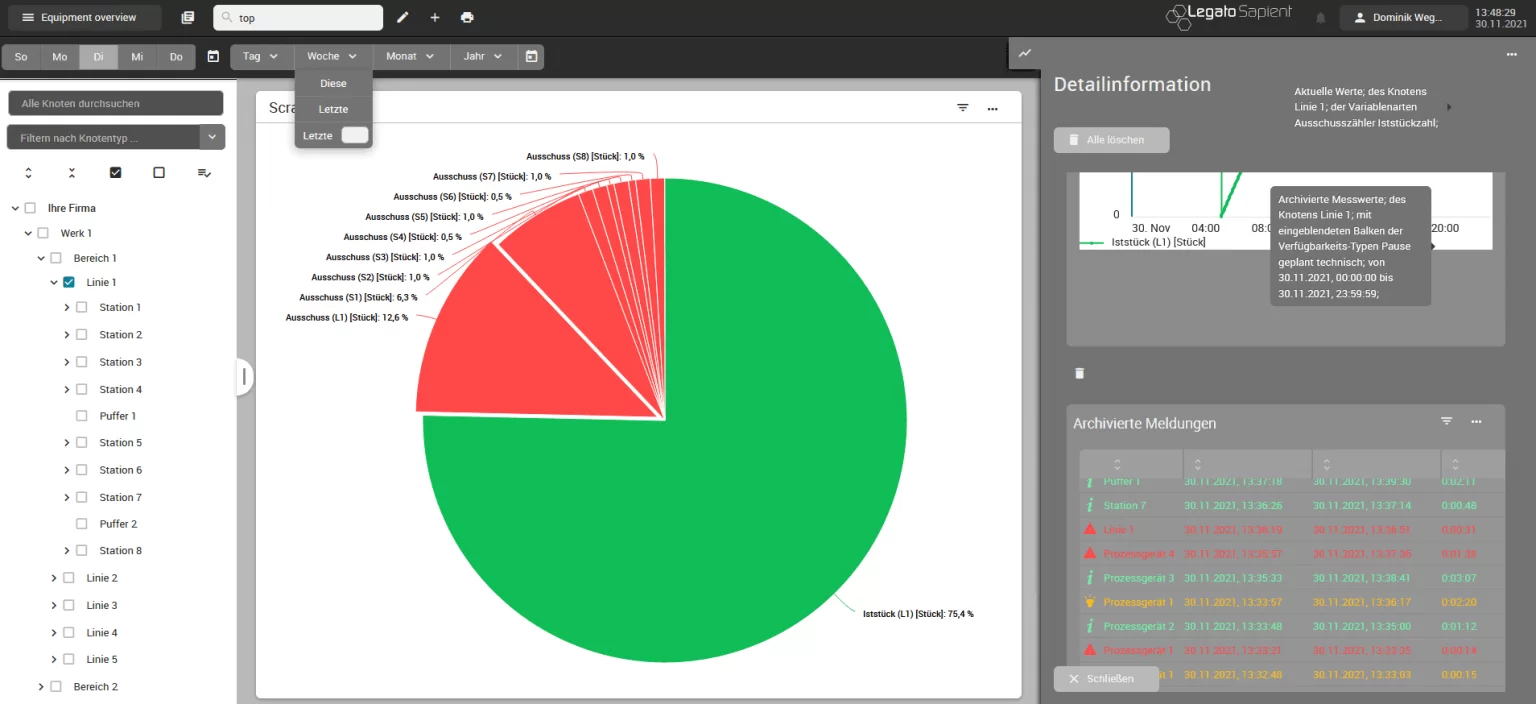
  • OEE analysis with key figures on output, quality rate, machine availability, MTTR, MTBF, etc.
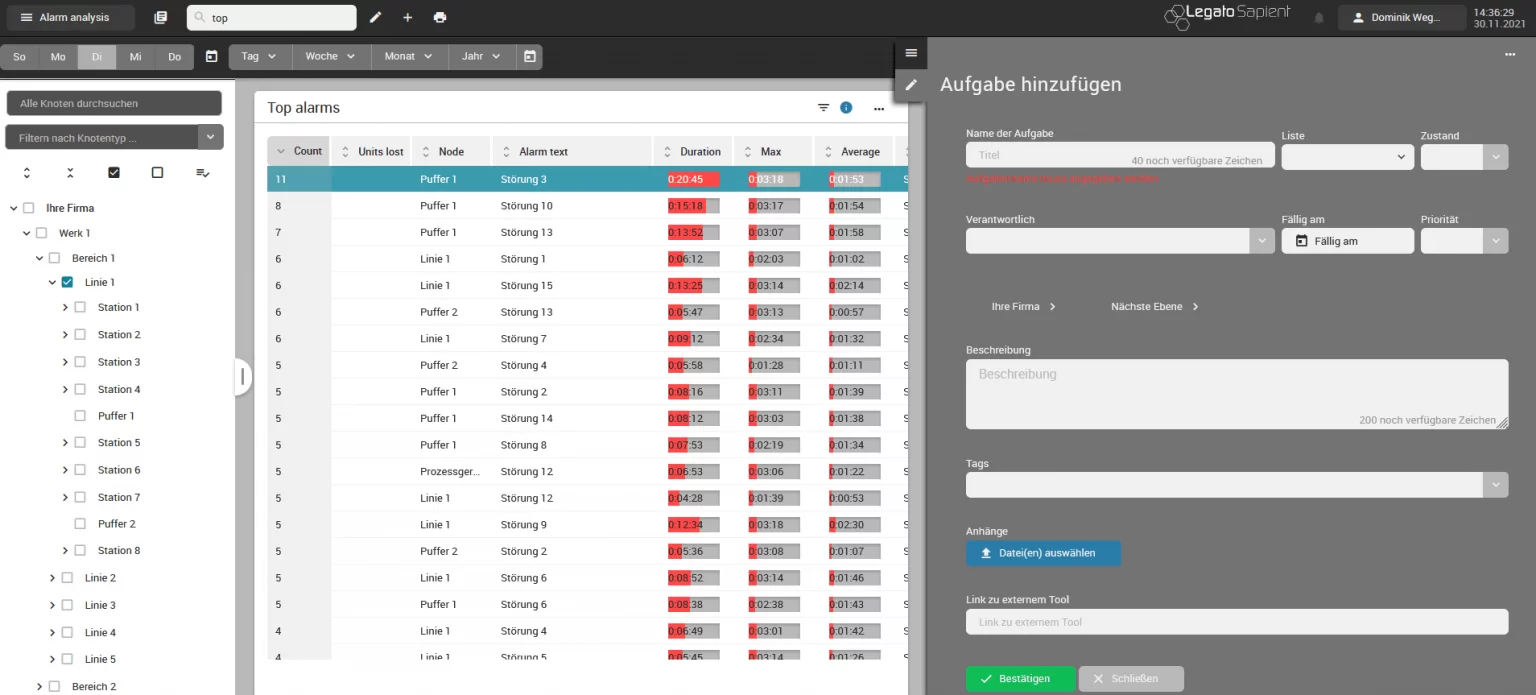
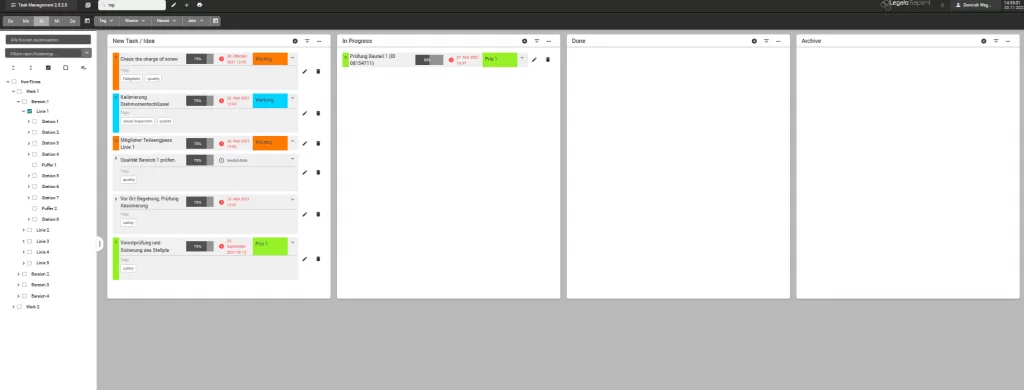
  • Integrated action management
  • Reducing the reaction time in case of machine downtimes
  • Improvement of Overall Equipment Effectiveness
  • Internal communication and collaboration

Discover the benefits for your industry and contact us for a presentation of Legato Sapient where we answer your questions about our software solution for OEE-monitoring.

Maintenance costs often skyrocket because the root causes of downtimes are not eliminated. Losses through downtime have to be made up for by working overtime or by keeping additional reserve capacity on standby. To effectively tackle the actual causes of downtime, Legato Sapient analyses every process step in real time, systematically evaluates machine and production data and aggregates these into meaningful key figures, such as OEE (Overall Equipment Effectiveness), MTTR (mean time to repair) or MTBF (mean time between failures).

TopX evaluations of machine downtimes and their causes reveal potential for improvement, which can then successively be implemented. Causes of problems can be tracked directly and eliminated via the integrated action management— fully in line with the continuous improvement process (CIP). This means that in the future, your day-to-day business will no longer be determined by problem-driven reactions, but by a proactive approach OEE monitoring allows you to plan strategically and take preventive actions.

Manufacturing data that creates business value

Production KPIs create transparency. The module of our MES software solution, Legato Sapient, enables the automatic calculation and aggregation of information. The insights generated in this way allow process deviations to be identified and resolved more quickly.

By using our OEE monitoring software solution, you can increase your production results by at least 3% — and generate additional millions in profit! The increase in OEE is based, for example, on higher equipment and machine availability through a shortened response time when malfunctions occur.

The analysis of historical production data can also be used to optimize the action management and prevent malfunctions ahead of time. Real-time OEE monitoring with regard to buffer levels and system interlinking can also help to avoid downtimes, which in turn can lead to an additional production output. Optimize the cycle time by reducing cycle time overruns. Smoothing out and minimizing cycle times also saves valuable minutes, which in turn helps to increase production output.

Legato Sapient: Your system for the long-term increase of production output

The base for manufacturing data lies in monitoring machines in real-time. Connect both homogeneous and heterogeneous machine parks via customizable interfaces. Regardless of the machine manufacturer — more than 2,000 machines can be attached to one system!

The collected data is then aggregated into meaningful key figures, such as output, quality level, machine availability, MTTR, MTBF and many more. Target and limit values can be set for each key figure, making it possible to monitor the actual status of the target value constantly. Access all information via a standard web browser and obtain detailed understanding through tabular and graphical visualizations on the key figures.

Our OEE monitoring solution enables you to evaluate deadlocks within the framework of, for example, reporting histories or the top 10 evaluations. Using these, you can first look at the errors that have caused the biggest problems (downtimes) within the scope of the CIP. By eliminating the causes of malfunctions successfully, recurring interruptions can be avoided in the long term.

Furthermore, our OEE analysis offers determined action and measure management in order to systematically and continuously solve and process various activities, such as recurring errors and interruptions as described above. For this purpose, you can create intervention steps for each event directly in the system. Establish your own tracking within the scope of CIP adding due dates and assigning tasks and responsibilities to the appropriate expert. Working within the tool simplifies team communication and cooperation significantly, as everyone has an overview of the measures and different subtasks. Furthermore, this information can be used for shop floor management and morning meetings, which means significantly increasing the depth of information here as well.

Make optimized, well-founded, and fast decisions in the future – thanks to intelligible production data analyses in near real time with Legato Sapient.

Click-Demo: OEE monitoring

True to the motto “all roads lead to Rome,” there are various starting points in Legato Sapient to improve the production output in the long term.

Visualization of actual vs. target number of pieces

Often, we start by looking at meaningful KPIs such as the availability of an area or a plant. In the following screenshot, several areas or plants can be compared with each other via “Multiselect.” In this case, we make a comparison of the output (actual vs. target number of pieces) and the availabilities (total, technical, organizational, and system-related):

visualization of actual and target number of pieces
Compare the availabilities of different areas and plants.

Identify the “weakest” plant or area, i.e., the “bottle neck,” using this comparison. Then apply a more in-depth analysis looking into the causes for the bottle neck. Typically, this includes error evaluations and TopX errors. Identify the main causes and take preventive measures in your CIP.

Visualization of limit and target values

In the following screenshot an alternative visualization is shown – availability values below a defined limit/target point are automatically colored. That way you recognize critical areas at one glance.

Color-coded marking of limit and target values
Visualize critical intervention steps for proactive action management with Legato Sapient.

This view serves as a basis for a more in-depth evaluation of the causes; typically, error evaluations and TopX evaluations are used for this again.

Identification and management of top errors

The following screenshot shows a TopX evaluation as mentioned above – the errors shown in red have been identified as particularly relevant, as they have already appeared as top errors over a longer period of time.

list of top errors
Identify the root causes of the top errors and initiate actions in the CIP to solve them.

Typically, we start with the error that has the greatest impact on downtime or availability. Define an appropriate intervention in the action management, set up a due date and assign the task to the person responsible. Subsequently, the “second most important” malfunction is dealt with in the same way.

list of tasks, responsible people, and due dates
Define intervention tasks and responsibilities to facilitate internal communication.

In the following screenshot a typical representation, a Kanban board, with all open measures is shown:

list of open tasks
Prioritize the intervention tasks on the Kanban board.

Input/Output: Reconstruction of the number of production rejects

To increase the production output, it is fundamental to avoid production rejects or keep the number as low as possible.

The following screenshot shows the relationship between reject and output piece counts.

diagram displaying production reject

Determine scrap piece counts to gain further insight into the OEE. For further action, explore the causes of the rejects. Click on a red pie slice and open the drilldown via the 3 dots at the top on the right. You will find the corresponding piece count history in the sidebar.

additional info on production rejects
Display the piece count history of the production rejects.

From this, a further drilldown will show the associated errors.

display of errors regarding the piece count history
Identify relevant information about the source of the error using the unit count history.

The main causes (malfunctions) are then solved by creating a task in the action management.

Further key figures of OEE monitoring

In addition to considering availabilities and quantities, further key figures (e.g., cycle times or energy values) are used to increase the production output.

The following example shows a typical display of cycle times, which helps detect errors in the process. In the lower area, each point represents a cycle time – all points that are not within the green-yellow band are cycle time overruns above the limit values, pointing out errors in the process.

visualization of cycle time overruns
Cycle time overruns are visually highlighted using defined thresholds.

As part of the further OEE analysis, you can “zoom” into the affected time range in the diagram. Use the drilldown (via the 3 points, at the top on the right of the boardlet) to get to the error messages of the affected time range. In order to avoid such malfunctions in the long term, create an intervention task in the action management as already described above.

FAQ: Important questions about OEE data collection

We compiled answers for the most frequently asked questions regarding OEE monitoring.

What does OEE mean?

Overall Equipment Effectiveness (OEE) is the metric used by manufacturing companies to evaluate the production output. OEE is the product of the key figures availability, performance, and quality. In an ideal OEE of 100 % a company would achieve the target rates within the available time and without production rejects. In reality, OEE values between 65% and 85% are considered good.

What does OEE monitoring software do?

By acquiring the production data of several plants or heterogeneous machine parks, even with more than 2000 devices, OEE monitoring software is able to track and evaluate the machine performance. Malfunctions or failures are reported in real time regardless of location. Using the action management within the OEE monitoring software, you can resolve the problem and assign tasks to the responsible department.

What are the benefits of using OEE monitoring software for your business?

Comprehensive manufacturing data allows you to optimize the production output at various levels. On short notice you will solve malfunctions in shorter reaction time. In the long run, you will identify top malfunctions in the data history and be able to eliminate the causes increasing your production output. Finally, OEE monitoring software simplifies communication and task distribution in your team.

What role does OEE monitoring play in CIP?

Analyzing the OEE in your company allows you to introduce continuous improvement processes (CIPs) and thus increase your production output sustainably. By using the data history to identify malfunctions and downtimes ahead of time, you can plan preventive maintenance measures. Optimize your production output and shape the collaboration proactively instead of just reacting after the damage is done.